財務ハイライト
左にスワイプしてご覧ください。
| 2020/3 | 2021/3 | 2022/3 | 2023/3 | 2024/3 | 2025/3 | |
|---|---|---|---|---|---|---|
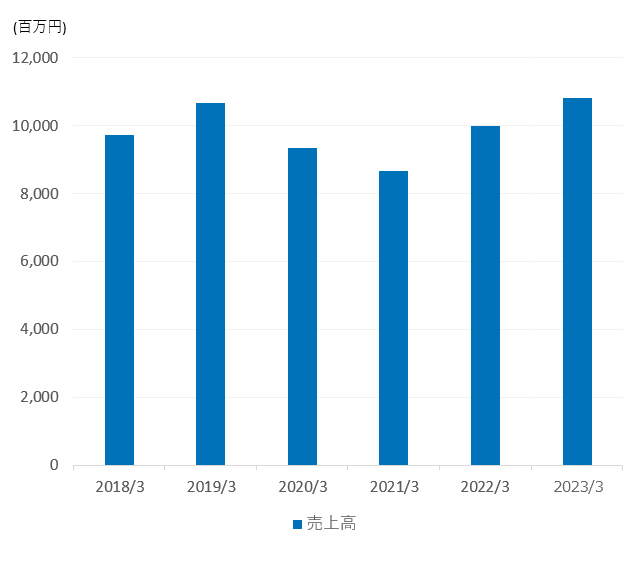
| 売上高(百万円) | 9,330 | 8,655 | 9,979 | 10,733 | 10,239 | 10,077 |
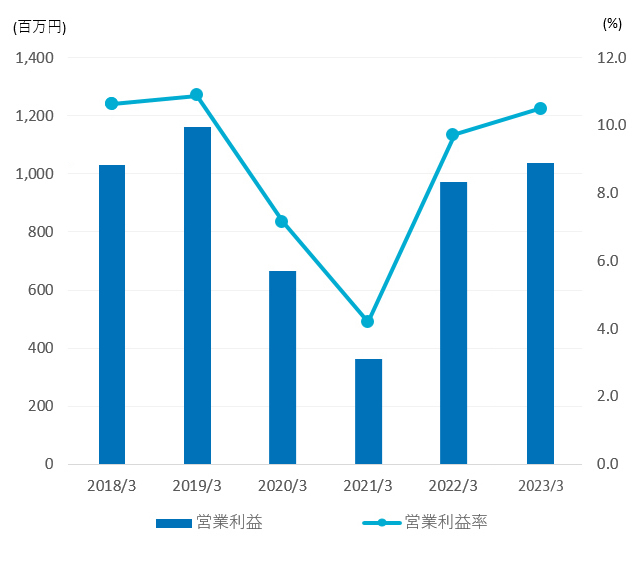
| 営業利益(百万円) | 666 | 363 | 972 | 1,102 | 918 | 638 |
| 営業利益率(%) | 7.1 | 4.2 | 9.7 | 10.3 | 9.0 | 6.3 |
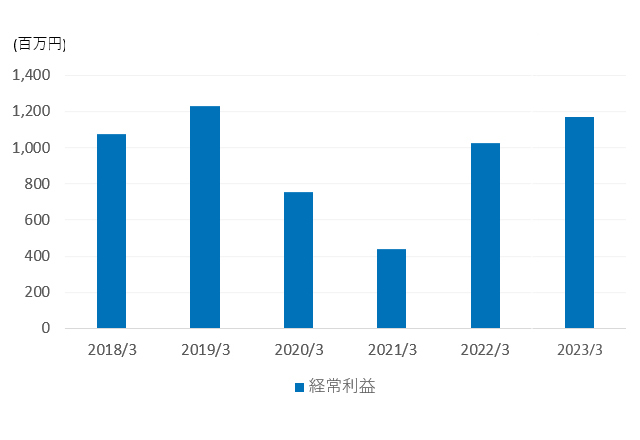
| 経常利益(百万円) | 752 | 440 | 1,028 | 1,177 | 992 | 720 |
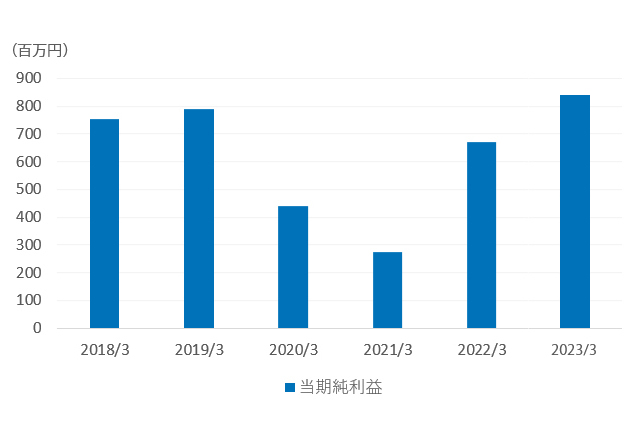
| 当期純利益(百万円) | 441 | 275 | 672 | 835 | 702 | 504 |
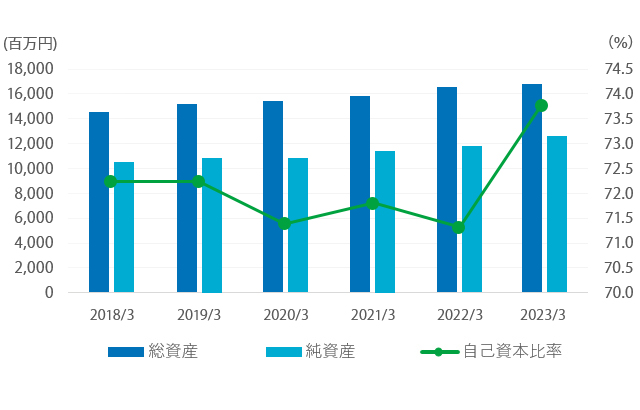
| 総資産(百万円) | 15,221 | 15,930 | 16,534 | 16,895 | 17,191 | 17,125 |
| 純資産(百万円) | 10,865 | 11,430 | 11,786 | 12,394 | 13,073 | 13,113 |
| 自己資本比率(%) | 71.4 | 71.8 | 71.3 | 73.4 | 76.0 | 76.6 |
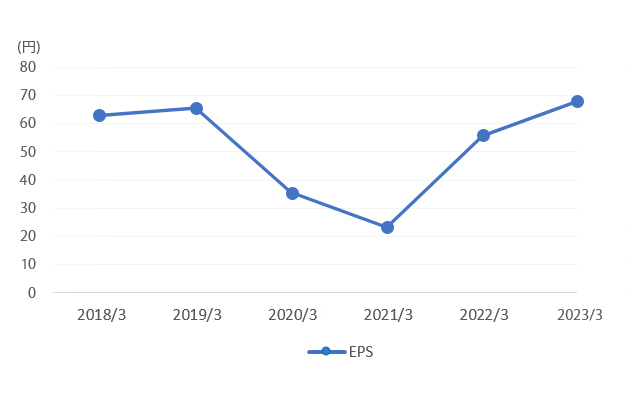
| EPS(円) | 36.95 | 23.00 | 56.29 | 69.99 | 58.81 | 42.16 |
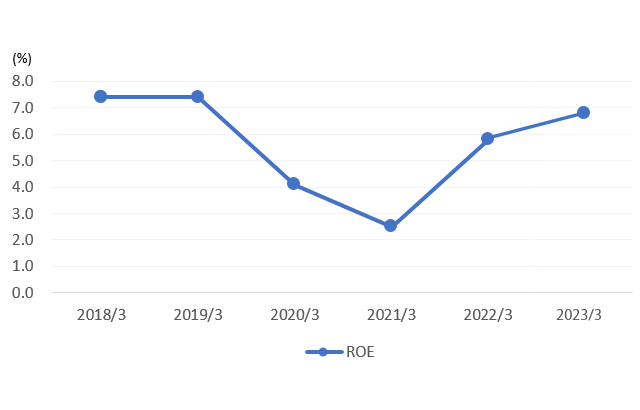
| ROE(%) | 4.1 | 2.5 | 5.8 | 6.9 | 5.5 | 3.8 |
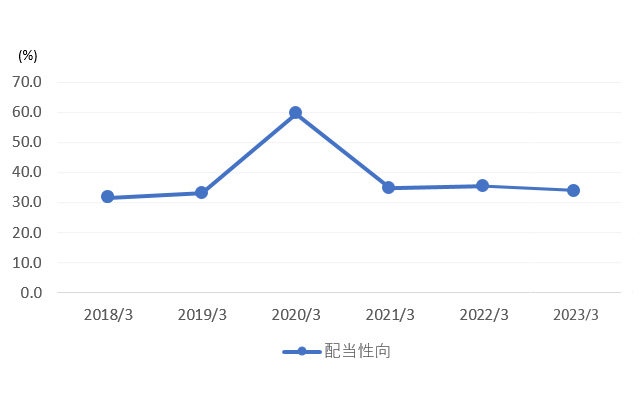
| 配当性向(%) | 59.5 | 34.8 | 35.5 | 32.9 | 41.3 | 50.4 |
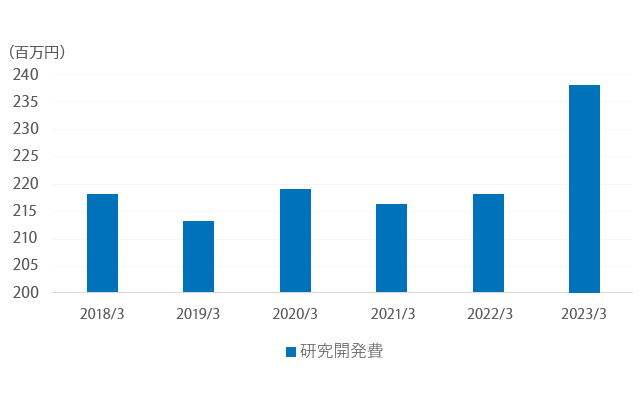
| 研究開発費(百万円) | 219 | 216 | 218 | 237 | 242 | 257 |
売上高
営業利益・営業利益率
経常利益
当期純利益
総資産・純資産・自己資本比率
EPS
ROE
配当性向
研究開発費